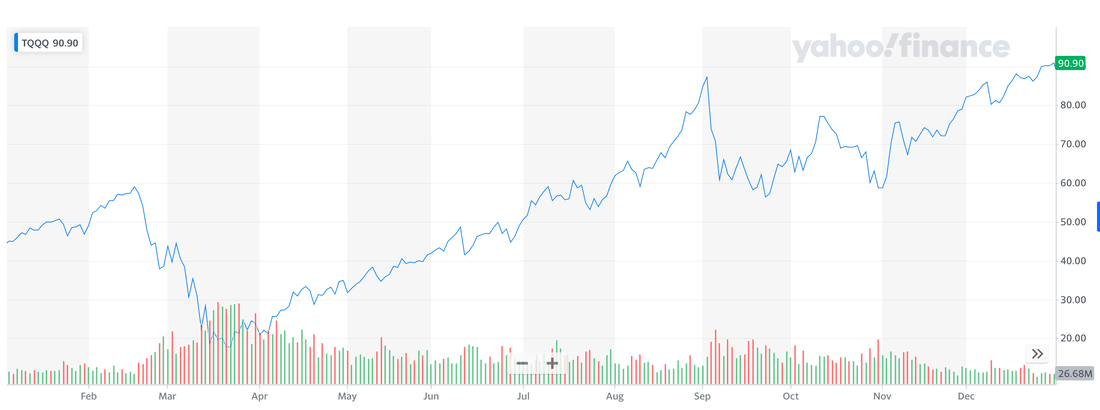
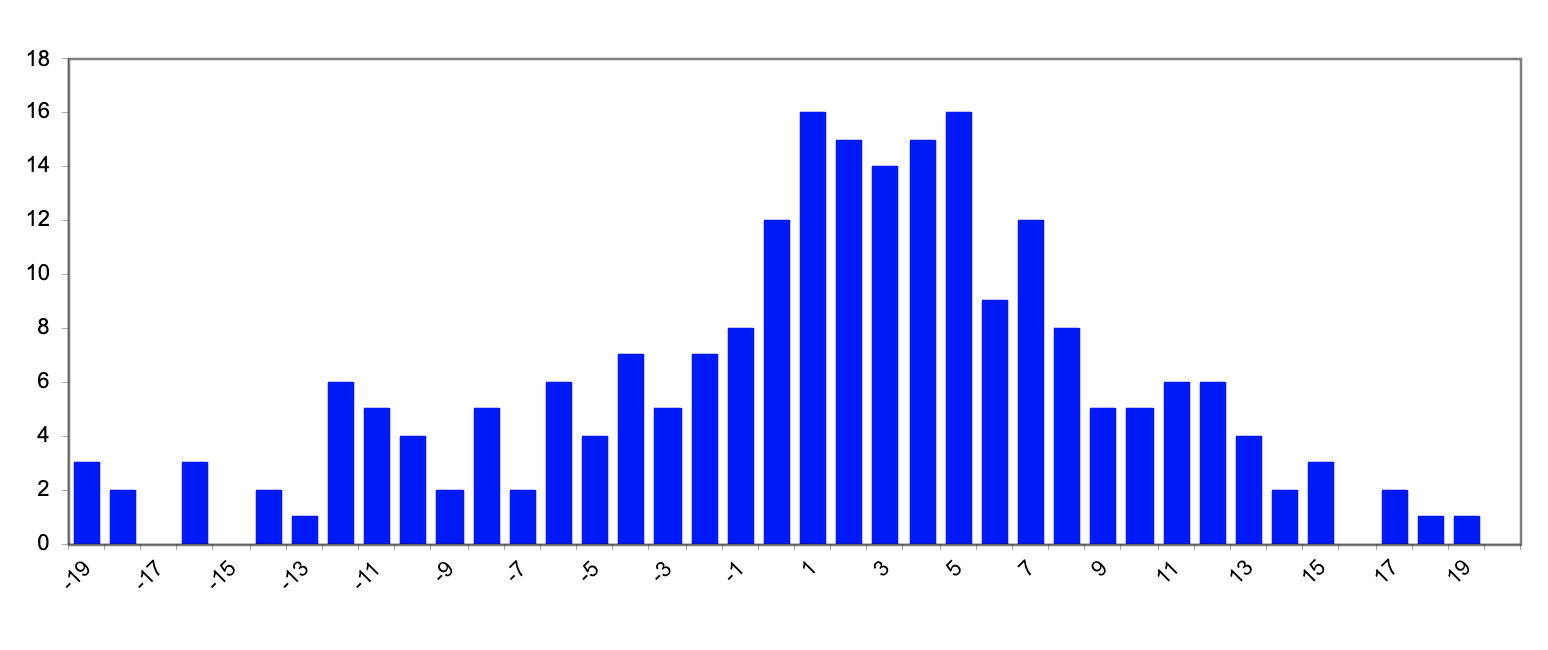
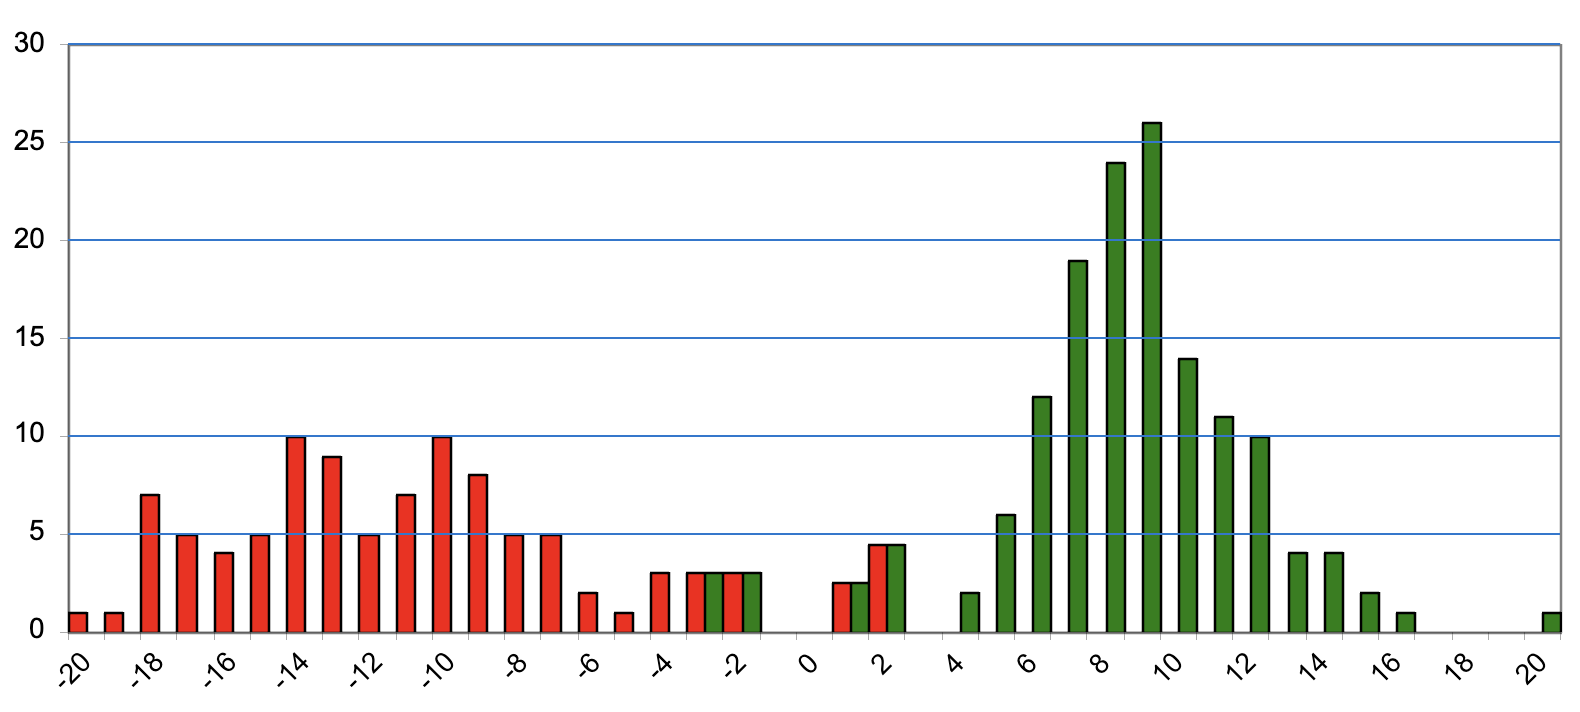
Alphament investing strategy is built on the momentum change of a stock's or an ETF's price movement. The momentum is determined by measuring the BB-Sigma Index, a real-time market sentiment statistic derived from the sum of all bull and bear trading actions retrieved from the stock exchanges. The best way to understand the Alphament Strategy is to show an actual example by breaking down each step of the trading action for any given stock or ETF.
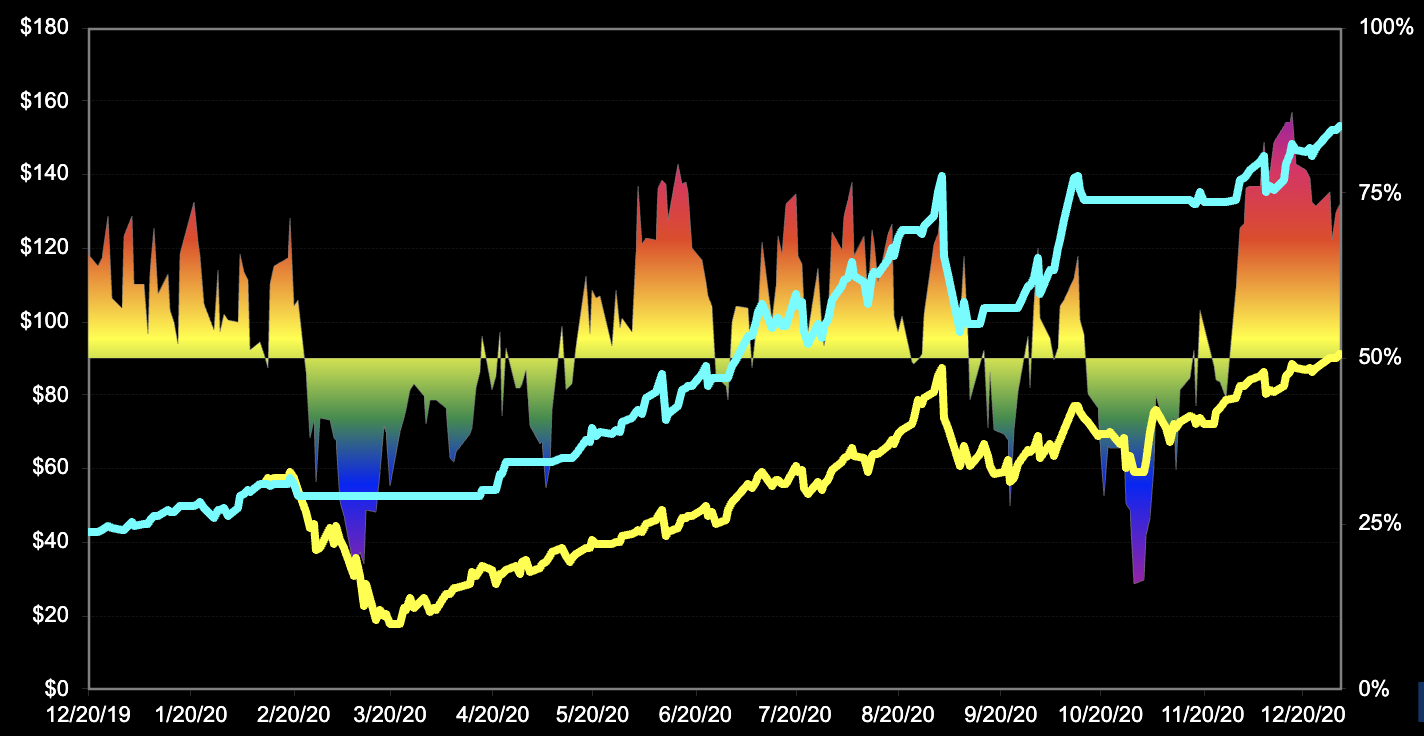
Step 4:Two distributions derived in Step 3 are statistically combined and calculated to formulate the BB-Sigma Index for making a buy (hold) or sell trade action, depending on the 50% Index value crossing as the action trigger.
The blue line shown on the chart represents the trading result using the Alphament strategy, while the yellow line is shown as the benchmark (buy-and-hold only). |
Step 5:Additional information can be revealed from the Alphament trading results. One example shown here is the monthly drawdown for the Alphament strategy (blue bar) and the buy-and-hold strategy (yellow bar).
The drawdown risk avoidance is the single most significant contributing factor for the outperformance of the Alphament strategy. In this example, drawdowns that happened in 4 months are completed avoided. |


