ALPHAMENT
  • Home
  • About
  • Investing Strategy
  • Performance
  • Availability
  • Contact Us

Alphament Portfolio Performance

Historical Alphament Portfolio Performance (2011 - 2020)

Important Disclosures and Assumptions

  1. Annual charts shown are based on the previous 260 trading days before the last day of the calendar year, i.e., each chart shows more than 365 calendar days.
  2. Annual return numbers shown under each chart is based on 253 trading days for the year.
  3. The Alphament Strategy result (blue line) is compared to the buy-and-hold benchmark (yellow line) for the same underlying trading security (TQQQ is used as an example).
  4. Each trade triggered by the BB-Sigma Index 50% crossing is assumed to have the trade order promptly executed at the opening price on the day when the signal is given.

Picture
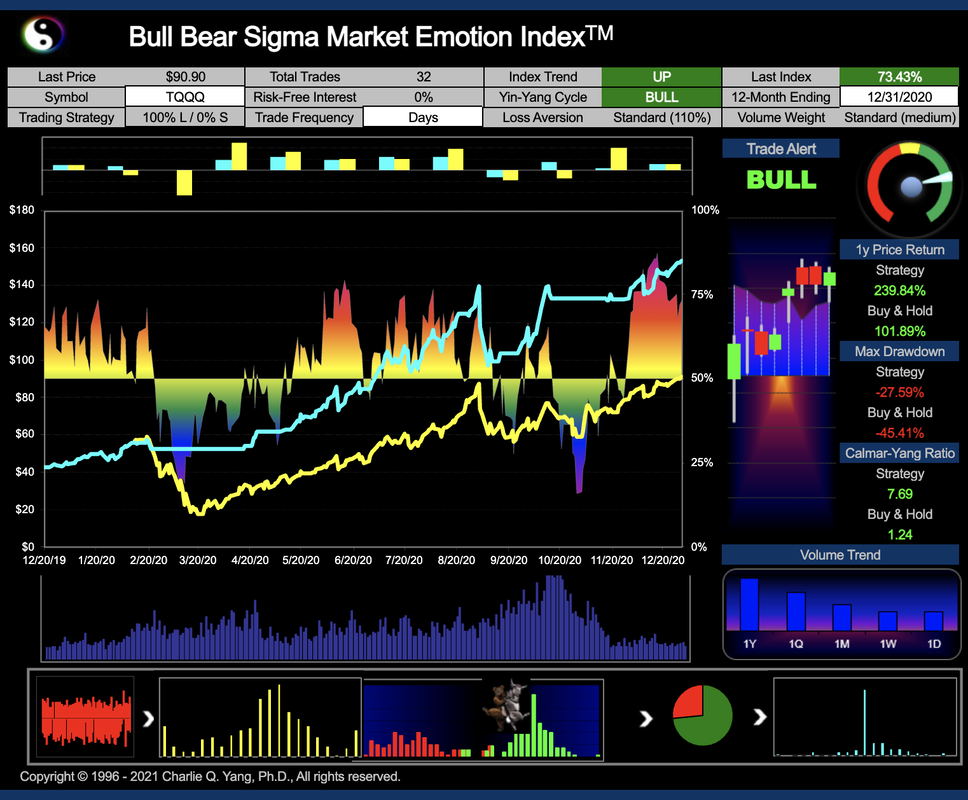
2020 Return: 239.84% Alphament Strategy vs. 101.89% TQQQ
How many months avoided/reduced Drawdown Risk: 4
Picture
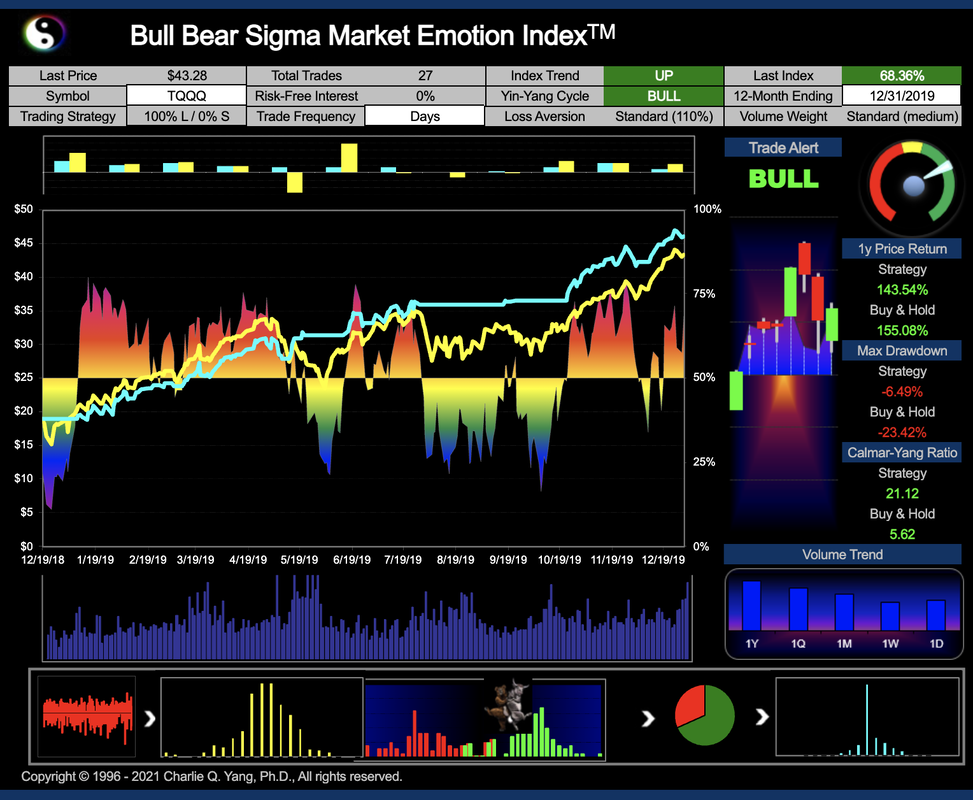
2019 Return: 143.54% Alphament Strategy vs. 155.08% TQQQ
How many months avoided/reduced Drawdown Risk: 2

Picture
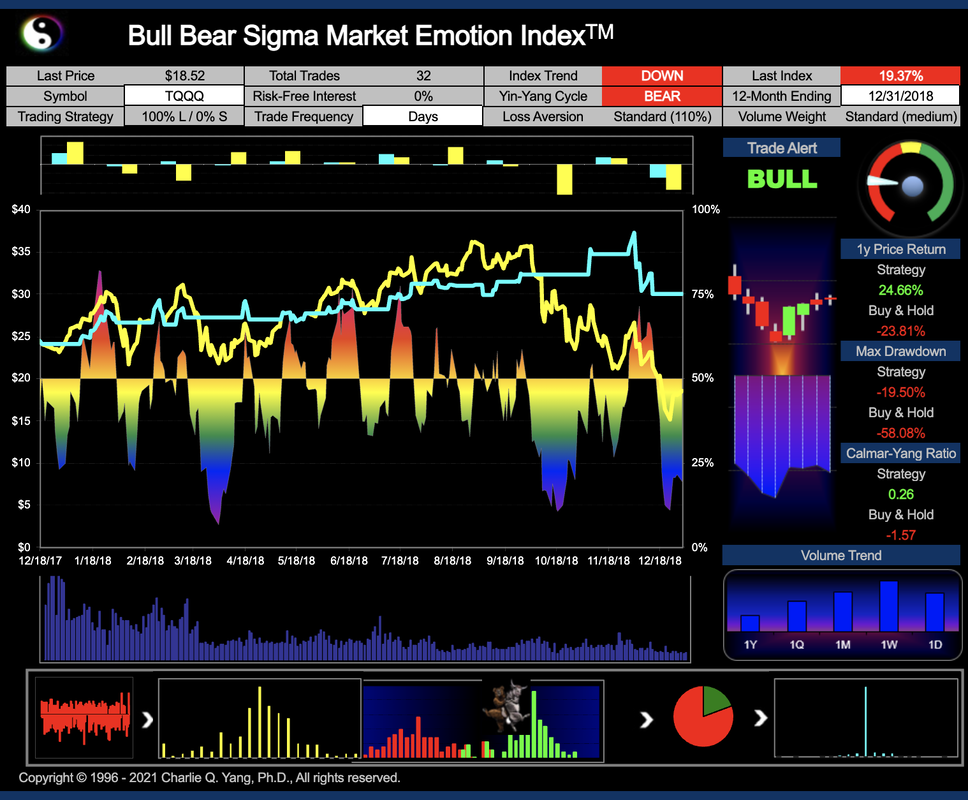
2018 Return: 24.66% Alphament Strategy vs. -23.81% TQQQ
How many months avoided/reduced Drawdown Risk: 5
Picture
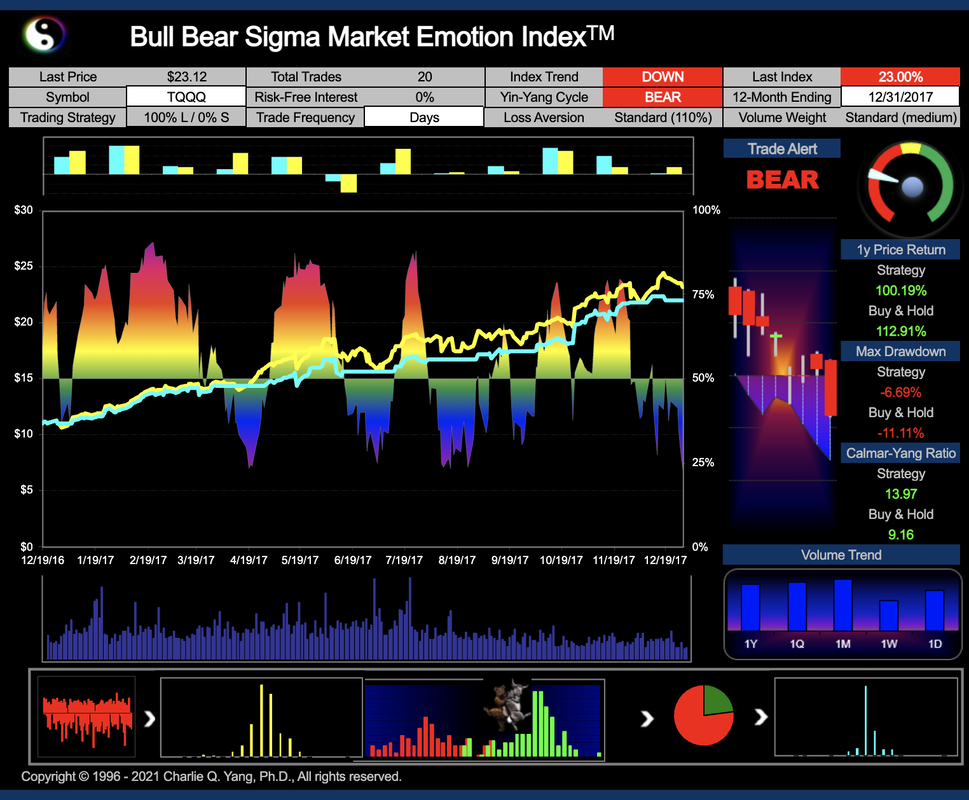
2017 Return: 100.19% Alphament Strategy vs. 112.91% TQQQ
How many months avoided/reduced Drawdown Risk: 1

Picture
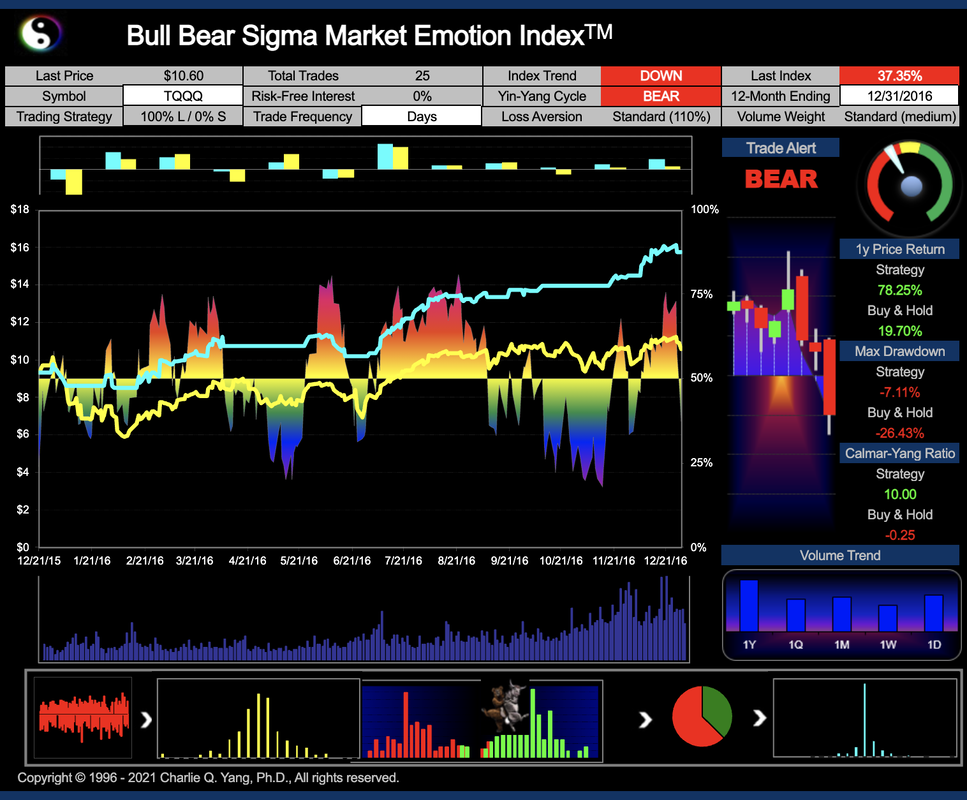
2016 Return: 78.25% Alphament Strategy vs. 19.70% TQQQ
How many months avoided/reduced Drawdown Risk: 3 (-1)
Picture
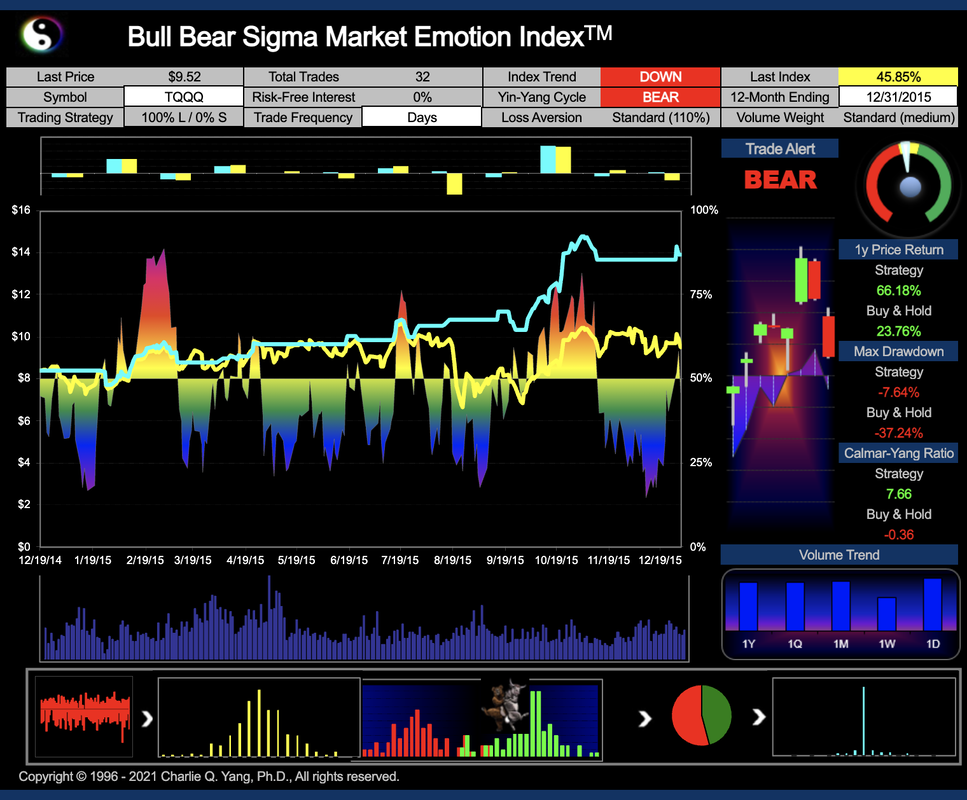
2015 Return: 66.18% Alphament Strategy vs. 23.76% TQQQ
How many months avoided/reduced Drawdown Risk: 4 (-2)

Picture
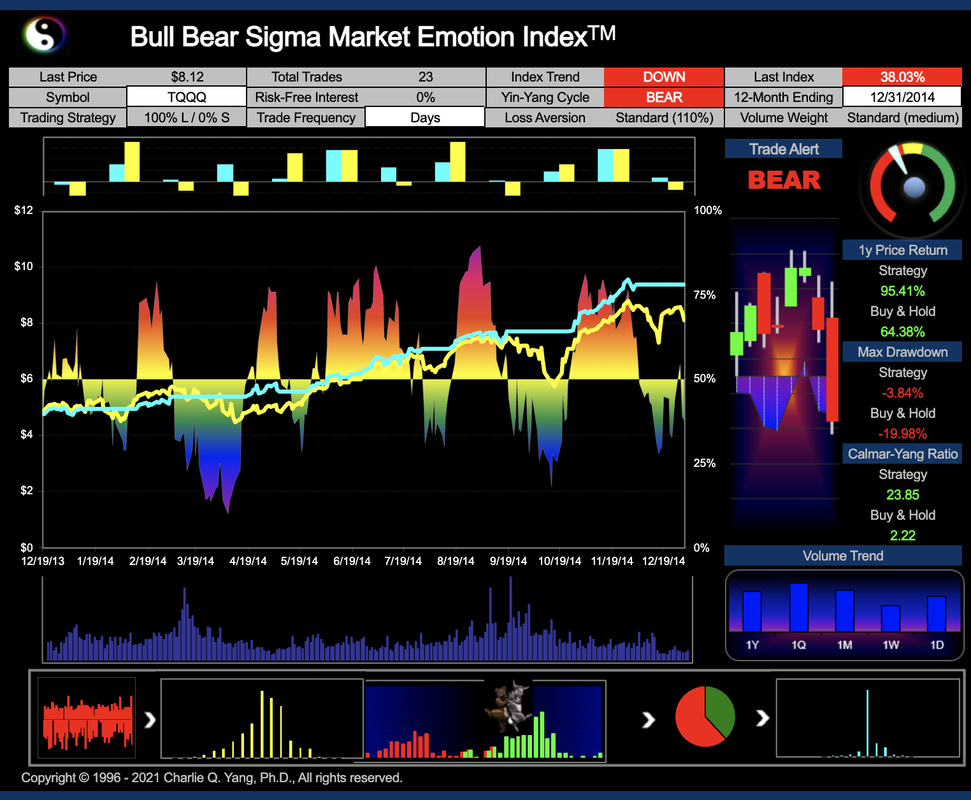
2014 Return: 95.41% Alphament Strategy vs. 64.38% TQQQ
How many months avoided/reduced Drawdown Risk: 6
Picture
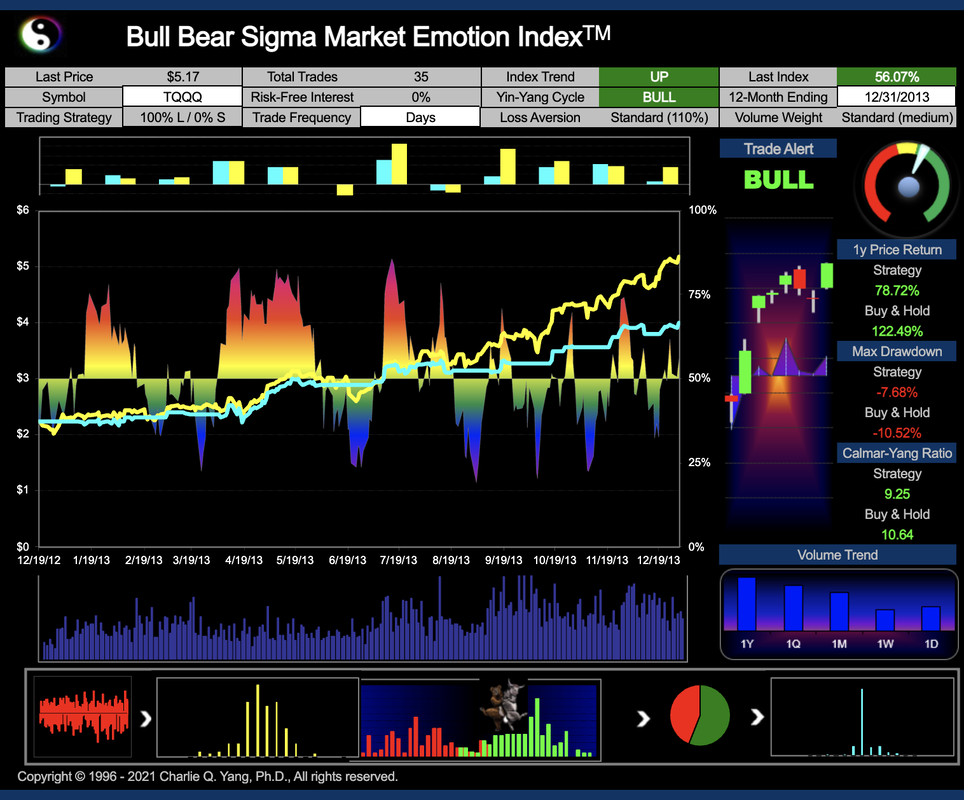
2013 Return: 78.72% Alphament Strategy vs. 122.49% TQQQ
How many months avoided/reduced Drawdown Risk: 2 (-1)

Picture
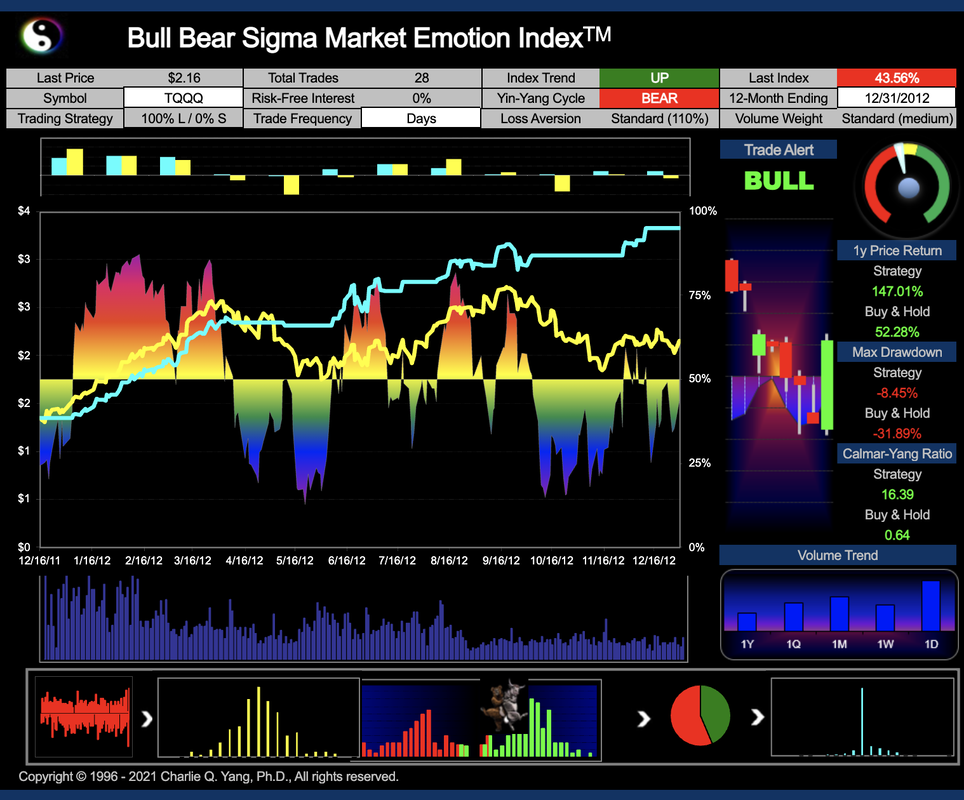
2012 Return: 147.01% Alphament Strategy vs. 52.28% TQQQ
How many months avoided/reduced Drawdown Risk: 4
Picture
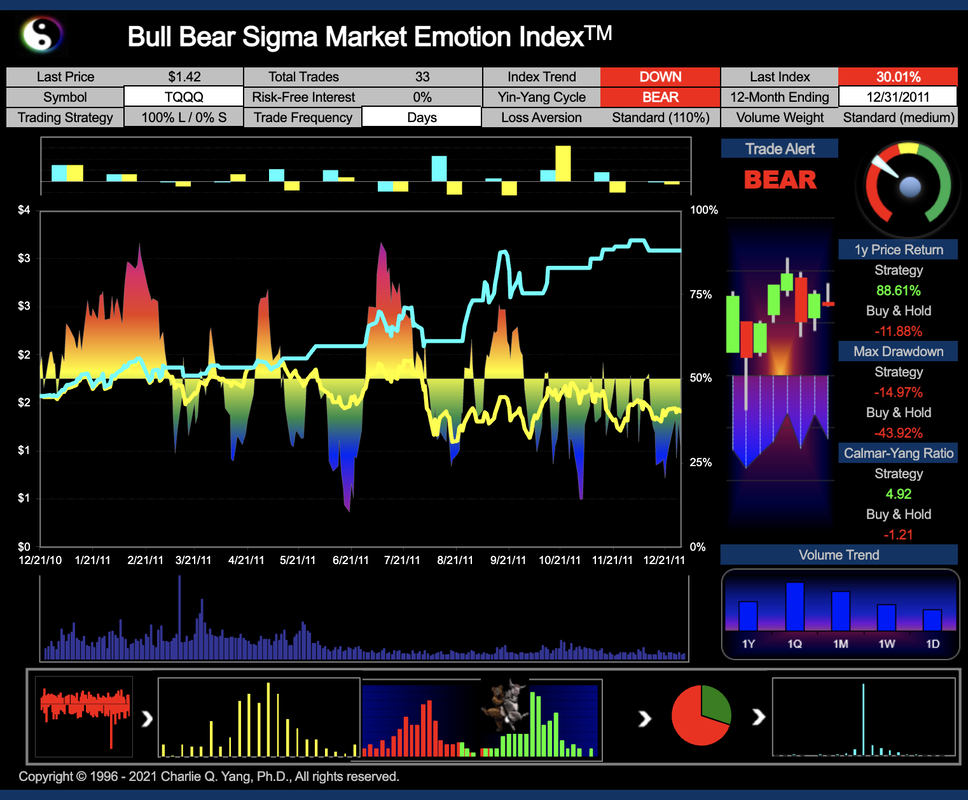
2011 Return: 88.61% Alphament Strategy vs. -11.88% TQQQ
How many months avoided/reduced Drawdown Risk: 6

This website is provided for informational purposes only. The content is not a prospectus, circular, or representation intended for use in the purchase of any securities. Investment products, including portfolios derived from the strategy presented here, are not federally or FDIC insured, and involve investment risk, including possible loss of principal and fluctuation in value. Consult with your tax advisor or attorney regarding specific tax issues.
Past performance is no guarantee of future results You should consider the investment objectives, risks, charges, and expenses of any investments carefully before investing. The market price for any portfolio utilizing our strategy is based on supply and demand which fluctuates daily based on many factors, such as economic conditions and global events, investor sentiment, and security-specific factors.
There is no assurance that the objectives of our strategy will be attained. Our views and opinions regarding the prospects of our portfolio holdings, any trading actions, and the economy are "forward-looking statements" as defined under the U.S. federal securities laws which may or may not be accurate and may be materially different over future periods.
Generally, forward-looking statements can be identified by terminology such as “believes,” “expects,” “estimates,” “may,” “will,” “should,” “anticipates,” “projects,” “plans,” “intends,” or other comparable terminology and by discussions of strategy. All statements involve known and unknown risks, uncertainties, and other factors, many of which are beyond the control of the website creator, which may cause the strategy’s actual results to be materially different from those expressed or implied by such statements.

Alphament.com is sponsored by American Financial & Investment Education Alliance (AFIEA.org)
​and American Financial Innovation, Assessment, and Evaluation (AFIEA.com)
© 1996-2021 AFIEA. All rights reserved.
  • Home
  • About
  • Investing Strategy
  • Performance
  • Availability
  • Contact Us